By Kevin
When discussing immigration, some tend to focus on the stories of individual immigrants or families, while others tend to focus on macro-level statistics that describe immigrants as a group. Both stories and statistics are valid and important parts of the conversation. Emphasizing one at the expense of the other can lead to grave errors.
If we focus only on statistics, it can be easy to forget that we are talking about image-bearing humans. In this blog, we will hear from the voices of immigrants and those who walk alongside them. We hope this will show the uniqueness of each immigrant’s story; immigrants are not a homogenous group. We also hope that you will be able to relate to and share the cares that they have.
If we focus only on stories, we can fail to understand the larger contexts of immigration debates. We can easily pick and choose stories that confirm our prior beliefs. Statistics are helpful for understanding the big picture. Of course, it is also possible to pick and choose statistics that fit into the narratives we hold, so we must 1) be critical of data sources, 2) reason properly and reasonably about data, and 3) be open to new data that others bring up.
Since the bulk of this blog will focus on stories, I’ll present some statistics here that may help inform our subsequent conversations about immigration. This post should be taken as a snapshot; there are certainly many other statistics that are relevant. I have chosen a few issues that we feel benefit greatly from knowing relevant statistics.
The number of immigrants is high, but it’s not exploding
In 2015, there were an estimated 43.3 million foreign-born people living in the US, about 13.5% of the total population. For the last 10 years, there have been just under 1.1 million people being granted legal permanent residence on average each year. In sheer numbers, this is close to the historical highs at the beginning of the 20th century. However, as a proportion of the US population, it has hovered between 0.31% and 0.34% per year over the last five years; it does not seem to have increased significantly.*
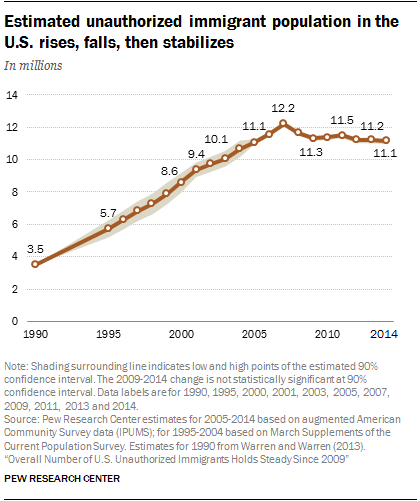
The figure above shows the estimated number of undocumented immigrants in the US over time. There were an estimated 11.1 million in 2014.** Between 1990 and 2007, there was large growth. The growth tapered off and stopped in 2008, at the beginning of the last administration. This suggests that the number of new undocumented immigrants is offset by the number who are deported or gain legal status. While there are indeed many immigrants coming into the US, the number is not increasing at a high rate.
Immigrants take some jobs, but affect different industries differently
Similar to the number of undocumented immigrants in the US, the number in the labor force competing for jobs increased until about 2008. In 1995, undocumented immigrants made up 2.7% of the labor force. In 2008, they made up 5.4%. Since then, it has hovered between 5.0% and 5.4% nationally.
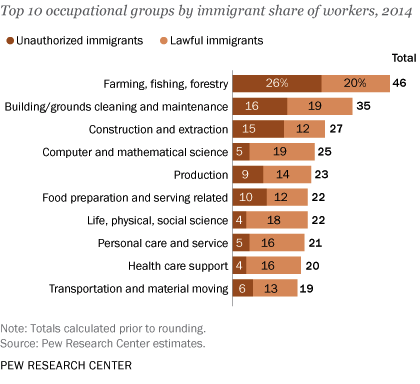
However, there are significant differences across geographic regions. While some states have seen labor force participation rates by immigrants plateau or even decrease (e.g. CA, NV, GA, SC), some states have seen increases (e.g. PA and VA). Aside from geographic location, these rates alse depend on the particular industry, and also whether we are looking at documented or undocumented immigrants (see the figure below). Generally, jobs requiring less skilled labor and those that are less regulated by professional bodies will have more immigrants.
These diverse findings may partially explain why you are either more concerned or less concerned about the economic effects of undocumented immigration than other people (in different jobs and different parts of the country). Any discussion about the economic impact of immigration should bear in mind that different people may feel the impact to different extents.
Immigrants are less likely than citizens to commit crimes
Increased immigration has sometimes led to fears of increased crime. Several studies (here and here) demonstrate that immigrants (both documented and undocumented) are less likely to commit crimes than native-born citizens in the US. While about 15 in 1000 natives are incarcerated, only 9 in 1000 undocumented immigrants and 5 in 1000 documented immigrants are incarcerated. This difference may be partially explained by the legal vulnerability faced by immigrants; the stakes (e.g. deportation) are higher, which restrains criminal activity.
This does not mean that crime committed by immigrants are more or less important or serious. Wise and righteous policing is needed to safeguard all communities from criminal acts. What the statistics suggest, however, is that political rhetoric blaming immigrants for rising crime is not rooted in fact. Since immigrants (both documented and undocumented) have such low incarceration rates, why does this issue generate so much political attention?
Avoiding extremes
Statistics are helpful for qualifying our claims: there are a large number of immigrants within the US, but the number is not exploding; immigrants take some jobs, but affect different industries differently. Statistics are also helpful for dispelling some falsehoods: immigrants are less likely to commit crimes.
As Matt has said, there are a range of legitimate positions different Christians could take on immigration. But whatever the position, let it be rooted in compassion and truth. Statistics do not equal or guarantee truth, but the right statistics enable us to get closer to it.
We will get to practice compassion as we listen to diverse voices speak about immigration in the coming weeks.
* Computed from Department of Homeland Security statistics and Census Bureau population projections.
** Another study estimated the figure was less than 11 million.